

Video analytics turns data-driven storytelling from a vague creative promise into a practical workflow. Instead of arguing over whether a video “feels right,” a team can use video content analytics to study view rate, drop-off points, completion rate, clicks, and conversions. Those signals show where the story earns attention and where it loses people.
The useful part is not the dashboard by itself. The useful part is the creative decision that follows: shorten a slow opening, move the product proof earlier, clarify the CTA, or build a second version for a different audience segment.

What video analytics means for data-driven storytelling
Video analytics is the measurement layer behind video strategy. It shows how people behave while watching, then connects that behavior to the next action. Data-driven storytelling uses those signals to make scripts, pacing, visuals, and calls to action sharper over time.
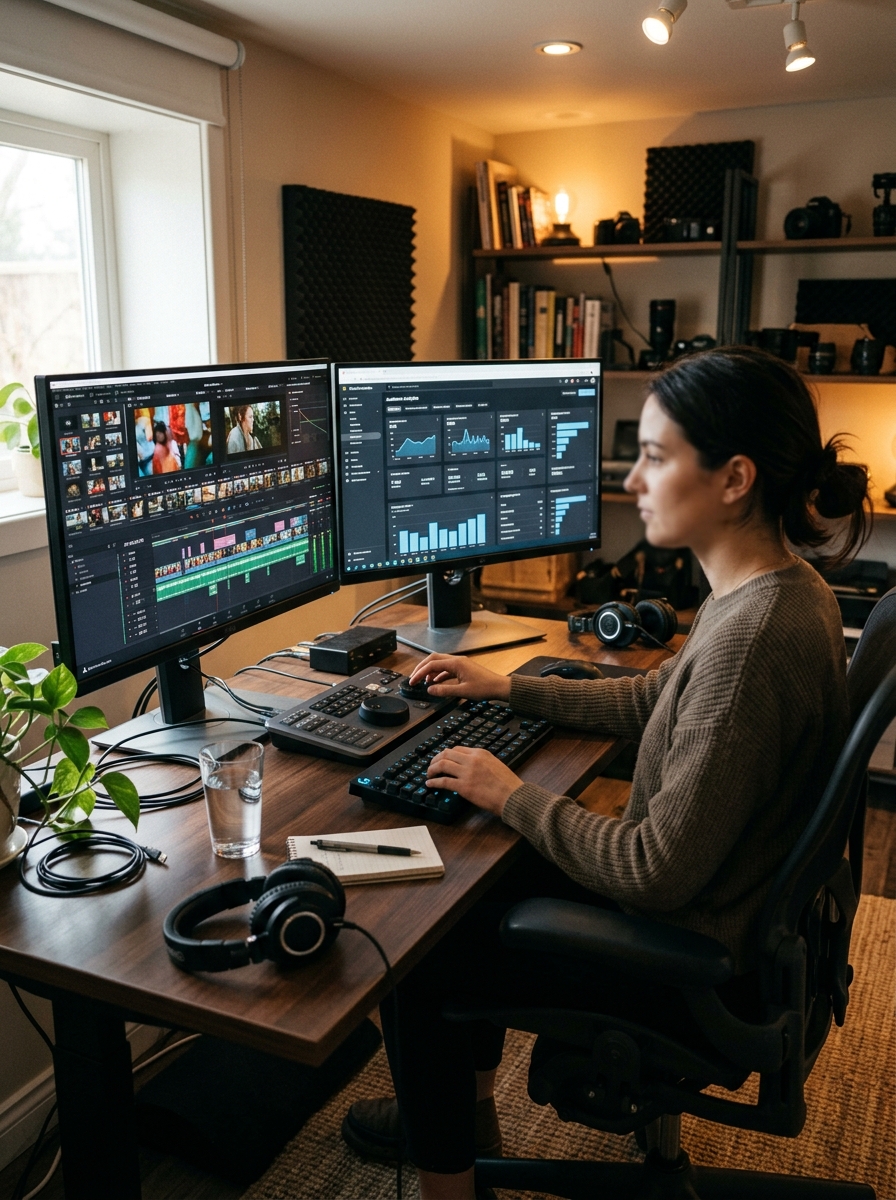
For creative teams, this is healthier than opinion-only review. A designer may love a slow cinematic intro. A sales team may want the offer in the first five seconds. Analytics gives both sides a shared language: did the audience stay, understand, and act?
| Signal | What it tells you | Creative response |
| View rate | Whether the hook earns attention | Rewrite the first line, thumbnail, or opening scene |
| Drop-off point | Where the story loses clarity or relevance | Cut friction, move proof earlier, or simplify the scene |
| Completion rate | Whether pacing and structure hold together | Tighten weak middle sections and remove filler |
| Click action | Whether the story creates intent | Make the CTA clearer, earlier, or more specific |
Video analytics metrics that matter
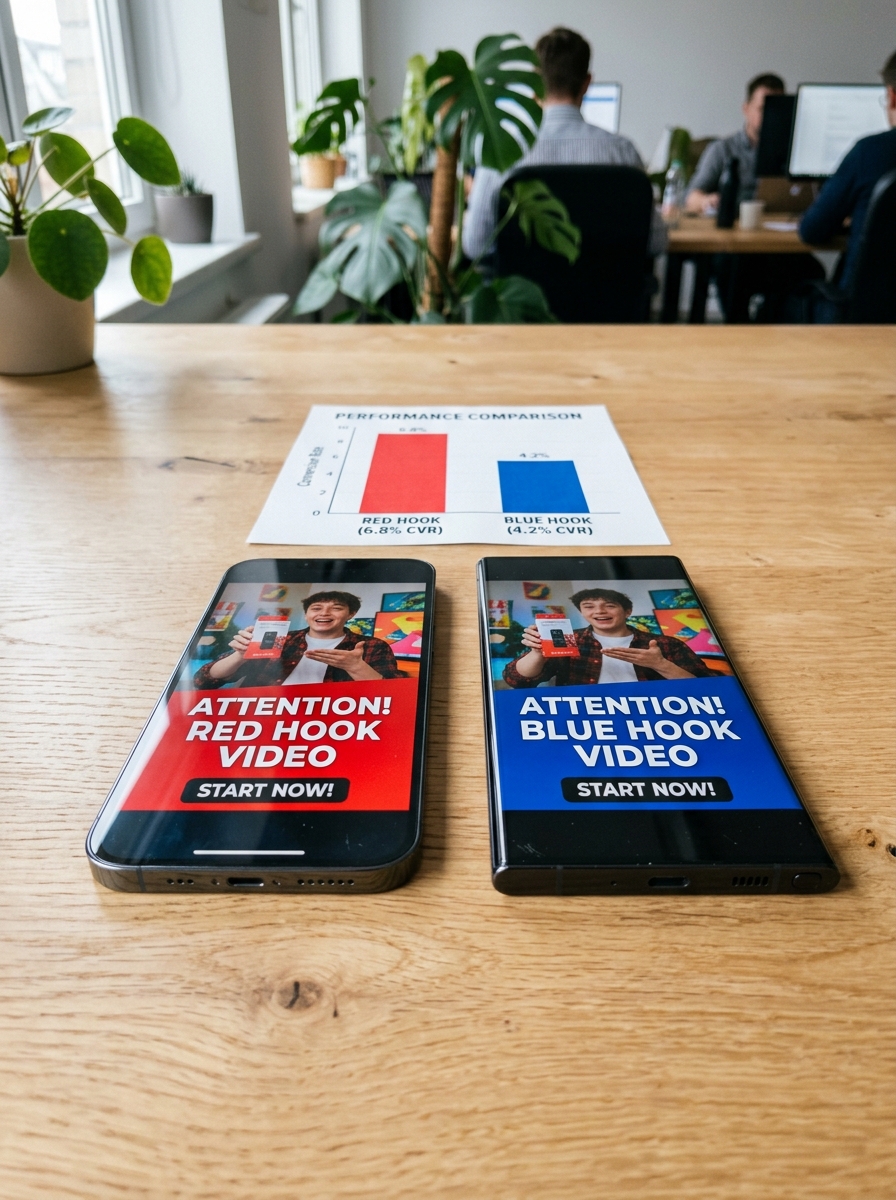
Not every number deserves the same attention. Views show reach, but they rarely explain whether a video worked. For video content analytics, I would start with retention, completion, and action metrics before chasing bigger vanity numbers.
View rate, watch time, and drop-off points
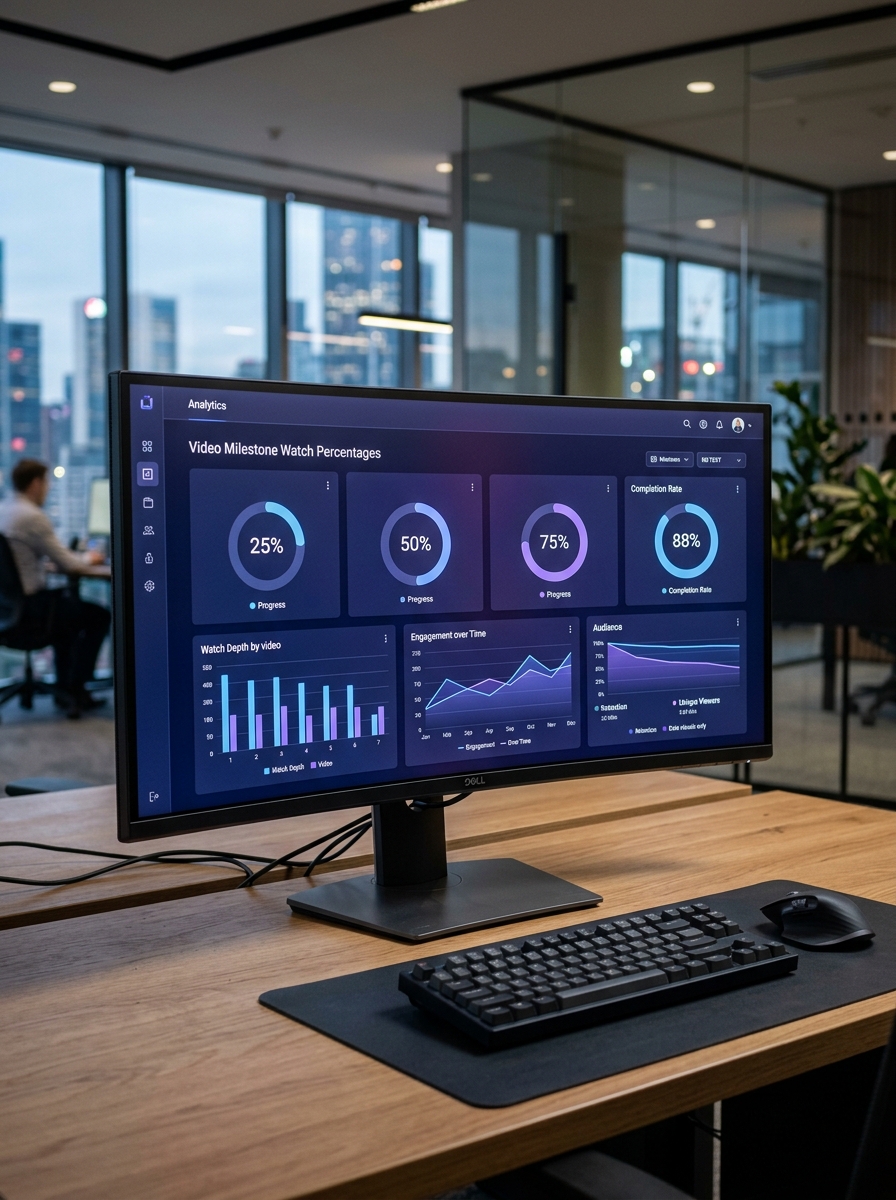
View rate tells you whether the first impression is strong enough to begin the story. Watch time and drop-off points show where the audience starts leaving. If a large drop happens before the main message, the opening is probably too slow, too abstract, or aimed at the wrong intent.
Completion rate, clicks, and assisted conversions
Completion rate is a useful signal for explainers, education, and product videos because it shows whether the structure holds. Clicks and assisted conversions matter when the video is meant to support a funnel. A video can be beautiful and still fail if no one takes the next step.

How to set up video tracking before launch
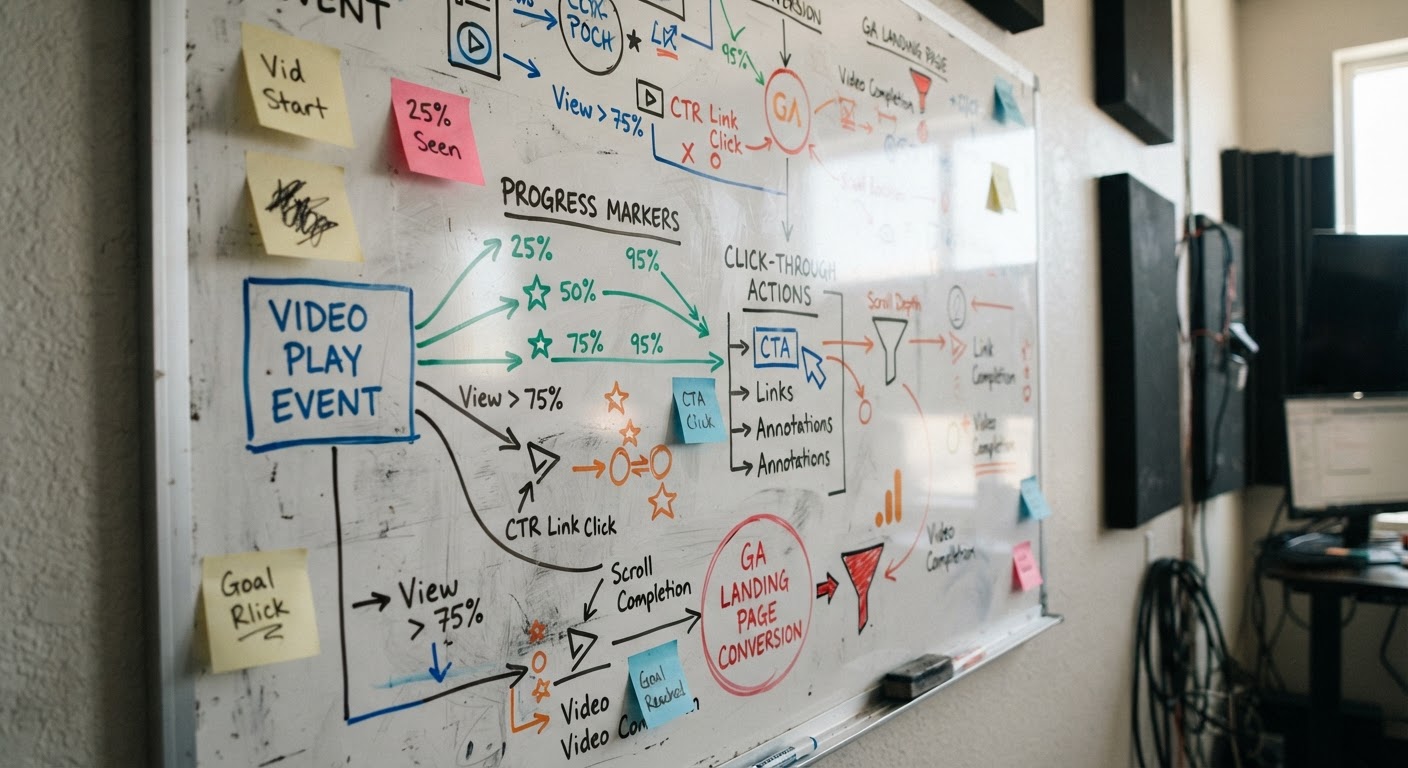
Tracking should be planned before the video goes live. If the team waits until after publishing, it often ends up with platform-level views and very little context. A cleaner setup maps play, 25%, 50%, 75%, completion, CTA clicks, and downstream actions to the same campaign structure.

For website embeds, GA4 events can show progress and post-view behavior. For paid media, platform data can show audience, placement, and creative variant performance. For CRM-led campaigns, the valuable question is whether video viewers become better leads, not just whether they watched.
A/B testing video without creative chaos
A/B testing video works when the test changes one meaningful thing at a time. Try a different hook, thumbnail, opening scene, CTA placement, or pacing choice. Avoid changing the script, visuals, voiceover, music, and offer all at once because the result becomes impossible to read.
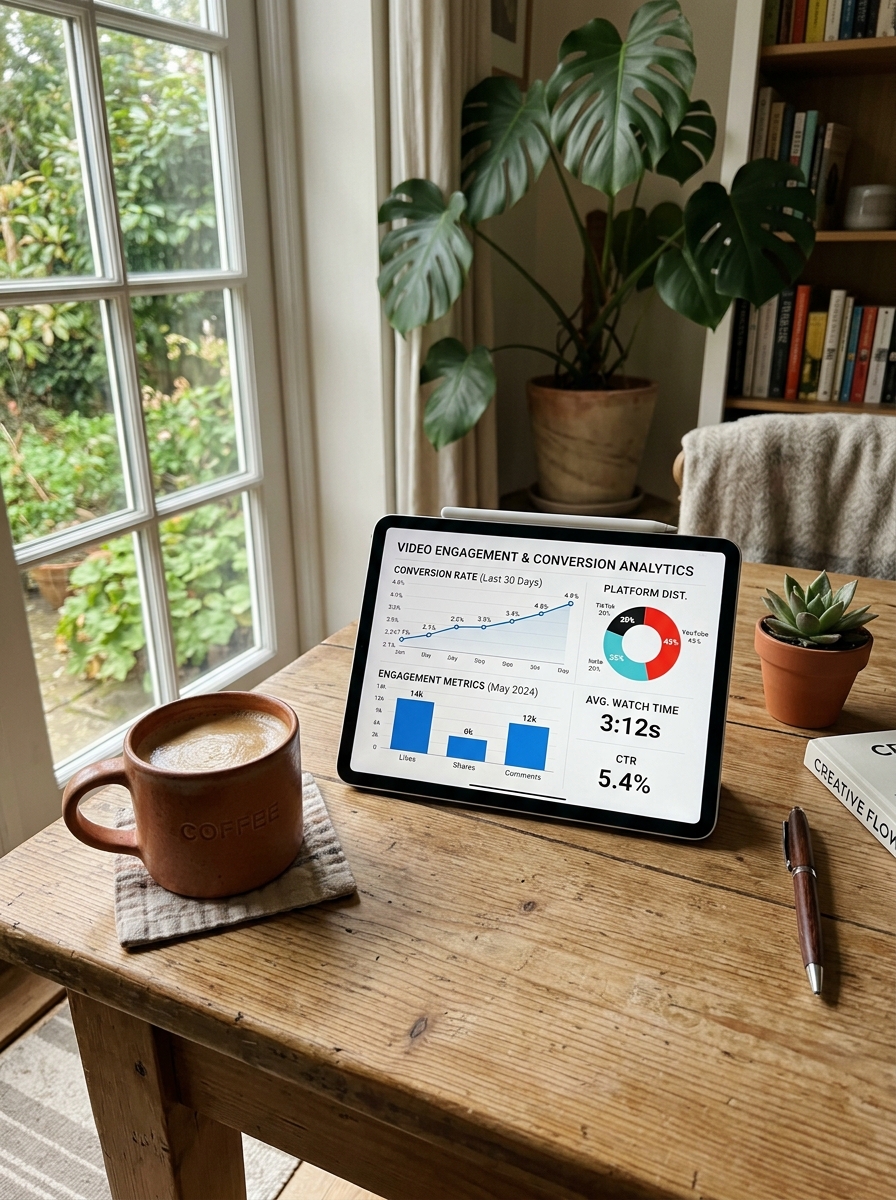
This is where analytics protects the creative process. The team can keep the brand system stable while still learning what improves attention and action. For related production choices, compare this with video editing software, video editing for digital marketing, and AI video generator workflows.
Turning insights into better storytelling choices
Data is only useful when it changes the next creative decision. If the audience drops during a dense feature list, the story may need a simpler problem-solution structure. If completion is strong but clicks are weak, the ending may need clearer value, stronger contrast, or a more visible CTA.
This is also where animation and motion design benefit from measurement. A studio can build modular scenes, swap an opening, tighten narration, or prepare a shorter cut without rebuilding the whole asset. For more context, see 2D animation studios for marketing, 2D animation in educational content, and 3D motion graphics services.
Video analytics workflow for creative teams
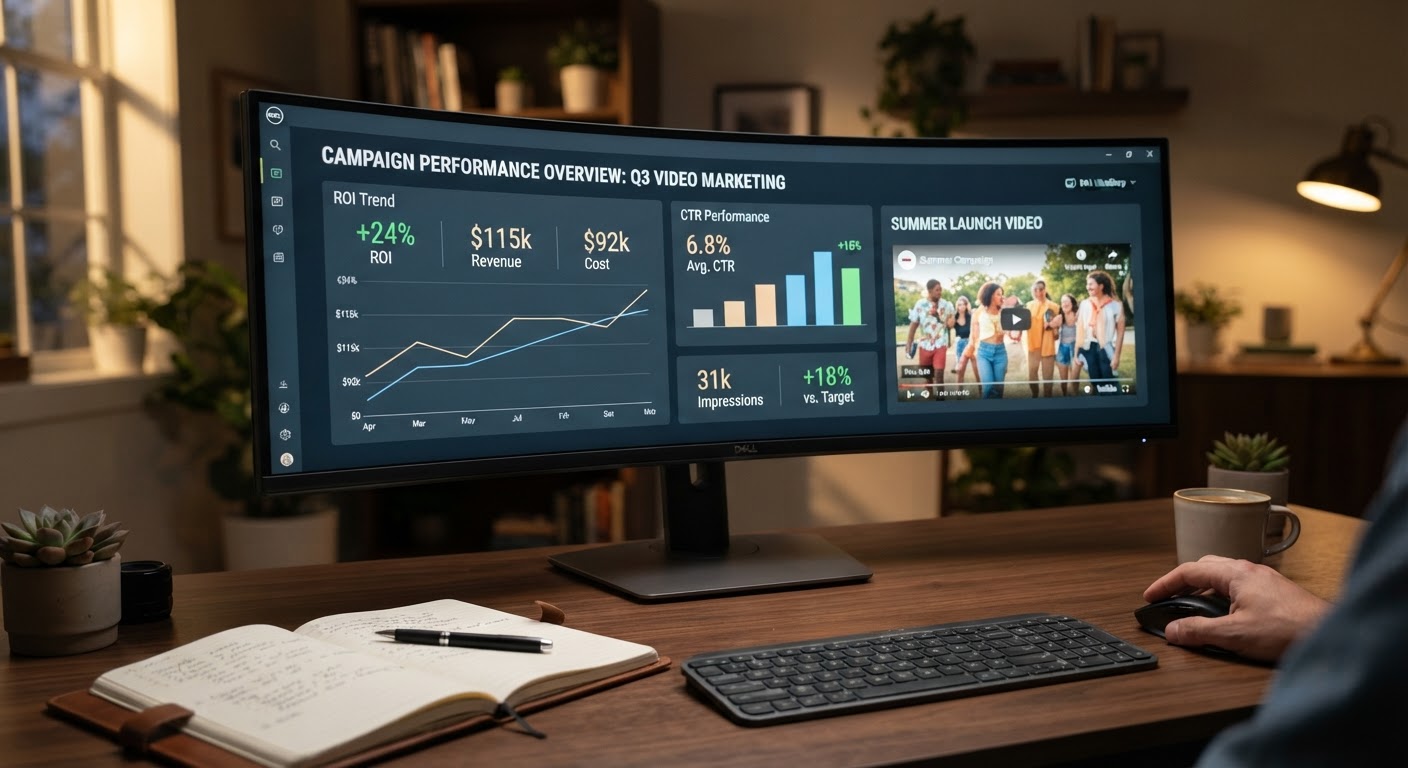
A simple workflow keeps the team from drowning in reports. Define the business question first, then choose the metrics that answer it. A launch video, product demo, training clip, and social ad do not need the same dashboard.
- Define the viewer action the video should support.
- Choose the primary metric before production starts.
- Plan event tracking for play depth, completion, and CTA clicks.
- Review patterns, not single-day anomalies.
- Make one creative change per iteration so the lesson stays readable.
- Document what worked and carry that learning into the next production cycle.
If your team uses AI in the process, keep the same discipline. Tools can create more versions faster, but video data analysis decides which version deserves more distribution. Related workflows include AI video creator tools, AI video enhancer software, and an AI face video workflow.
Where Darvideo fits into analytics-led production
Darvideo positions analytics as part of the production model, not a report added after the fact. The studio works across 2D animation, 3D animation, motion design, explainers, character animation, whiteboard videos, business videos, e-learning videos, and product videos.
The stronger approach is to design each video so it can be measured and improved. That means modular scripts, replaceable scenes, clear CTA moments, and performance notes that help the next campaign start smarter. You can review the commercial service page here: video animation services.
For the broader marketing layer, connect this process with a data-driven marketing strategy so video analytics sits inside the funnel instead of floating as a separate creative report.
FAQ: video analytics and storytelling
What is video analytics?
Video analytics is the process of measuring how people watch and act after a video. Useful signals include view rate, drop-off points, completion rate, clicks, assisted conversions, and audience segments. For storytelling, the goal is not to collect every number. The goal is to see where attention rises, where the message loses people, and which creative choices lead to action.
How does video analytics improve data-driven storytelling?
Video analytics improves data-driven storytelling by turning audience behavior into creative direction. If viewers leave before the product benefit, the opening may be too slow. If they watch but do not click, the CTA may be weak or too late. The best teams use these signals to tighten scripts, adjust pacing, clarify visuals, and plan the next version.
Which video engagement metrics matter most?
The most useful video engagement metrics are view rate, average watch time, completion rate, drop-off points, replay behavior, click-through rate, and assisted conversions. Raw views can be useful for reach, but they do not prove that the story worked. A smaller audience with strong completion and action may be more valuable than a large audience that leaves after a few seconds.
How do you track video analytics in GA4?
In GA4, track video analytics with events for play, progress milestones, completion, and clicks after the video. For embedded players, teams often send custom events for 25%, 50%, 75%, and 100% progress. Then connect those events to landing-page behavior, form starts, purchases, or CRM-qualified leads so the video is judged by outcomes, not isolated views.
Can video analytics guide A/B testing?
For compact spaces, incorporating functional apartment balcony decorating ideas can create a highly inviting relaxation zone.
Yes. Video analytics is one of the cleanest ways to guide A/B testing because each version can test a specific creative variable. Test the hook, thumbnail, first scene, narration pace, CTA placement, or ending frame one at a time. If every variable changes at once, the data becomes noisy and the team cannot tell what actually improved performance.
What is the difference between video analytics and video content analytics?
Video analytics usually focuses on performance data such as plays, watch time, retention, clicks, and conversions. Video content analytics looks more closely at the content itself: scenes, topics, objects, sentiment, pacing, and structure. Together, they help a team understand both what happened and which part of the video may have caused it.
- 17shares
- Facebook0
- Pinterest17
- Twitter0
- Reddit0